End to End Moto NewsFeed Analytics Framework
Company: Motorola Mobility
Tools: BigQuery, Dataform, SQL, LookerStudio, Event Tracking, GCP
Timeline: Iterative/Ongoing
Status: In production
Overview
I designed, developed and deployed a production grade analytics framework that transforms raw, nested user event data into trusted and decision ready metrics; delivered through dashboards and used by product managers and business stakeholders.
The system supports the Moto NewsFeed software product and its service offerings, including partnerships with Microsoft CoPilot and Taboola. It enables consistent measurement of user retention, engagement, feature adoption and overall product performance directly informing roadmap, experimentation and P&L related decisions.
The project spans the full analytics lifecycle, from data modeling and orchestration to stakeholder collaboration and iterative dashboard and metric design.
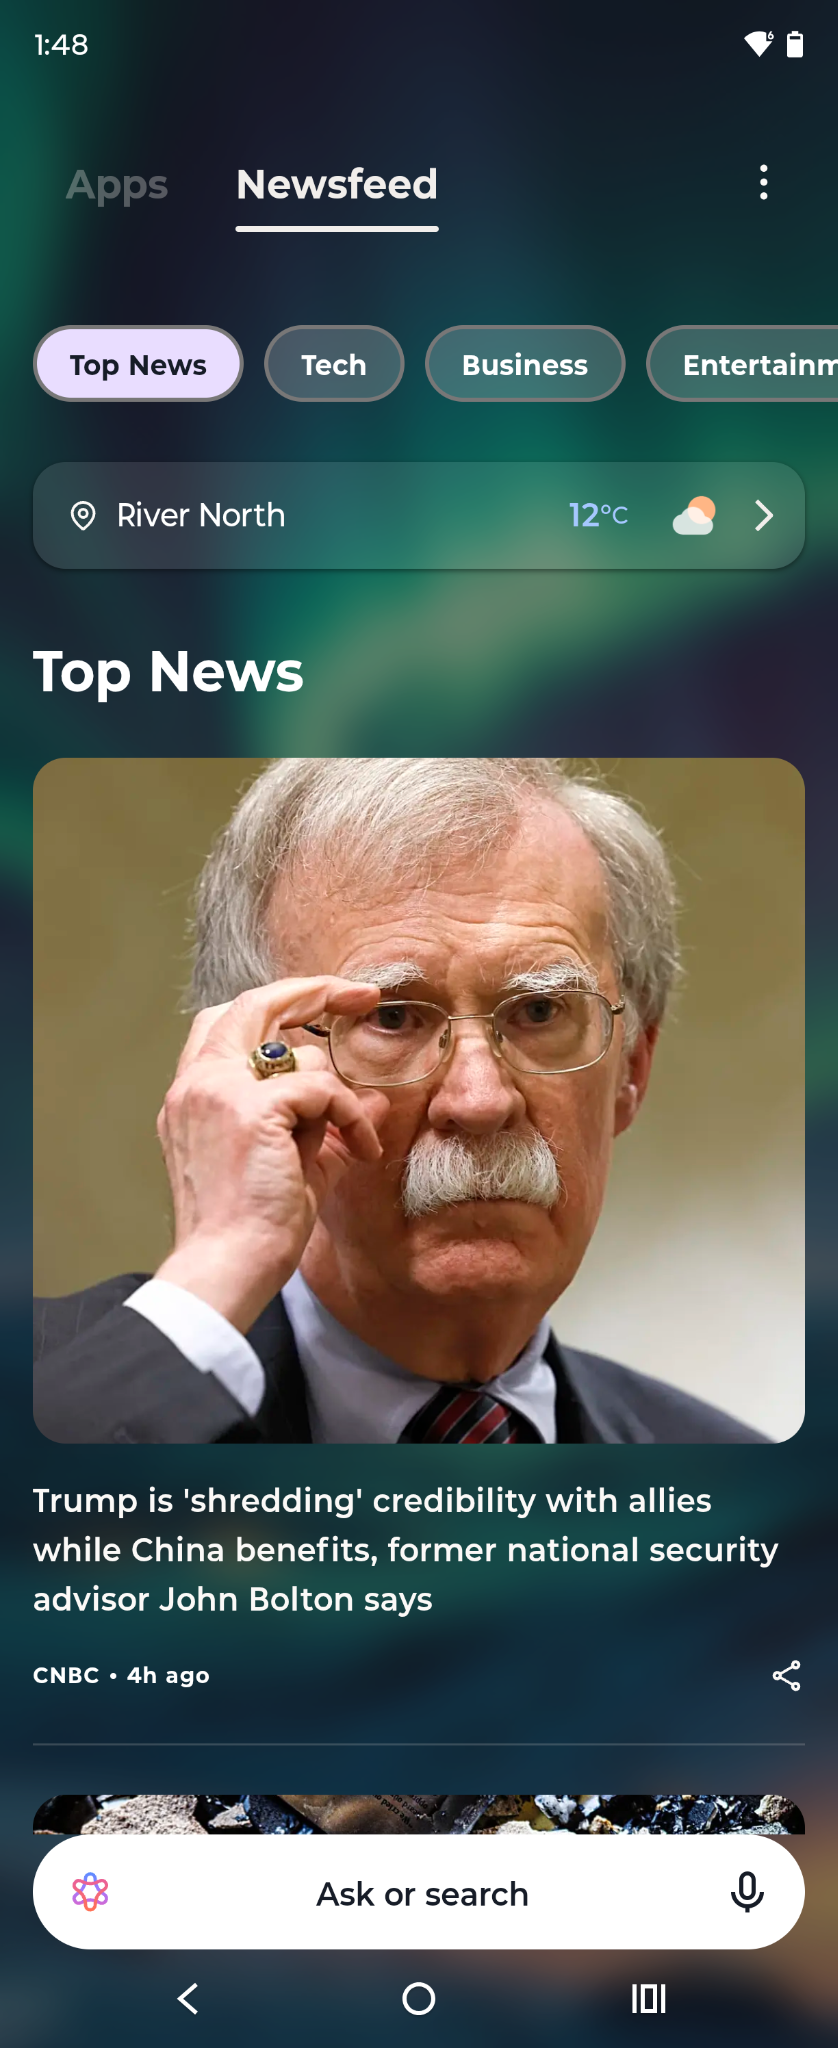
Screenshots of the NewsFeed Software Product:

The Situation
In early 2025, Moto Newsfeed launched to in market consumer devices and began generating large volumes of raw and nested event data that:
- Was inaccessible to product and business stakeholders
- Complex and difficult to model or query efficiently
- Lacked standardized definitions for engagement metrics
- Required manual or ad hoc analysis to answer product and feature performance questions
- Limited PM’s ability to self serve insights and decision intelligence
Product managers and business stakeholders needed clear, reliable and accessible analytics to evaluate feature performance and guide product decisions.
Goals and Success Criteria
- Create a scalable analytics framework for NewsFeed specific user event data
- Enable self serve dashboard for product and business teams
- Ensure cost efficient data architecture and automated daily updates
- Build analytics that can evolve alongside the product roadmap
My Role
I owned and continue to own the project end to end, including:
- Designing the analytics data model framework
- Building the transformation logic in BigQuery
- Orchestrating the models and dependencies with Dataform
- Implementing daily automated runs via cron (Dataform Release & Scheduling)
- Designing and delivering dashboards and visualizations
- Partnering closely with product managers and business developers
- Translating product and feature performance into measurable analytics
Technical Project Details
Data Architecture
~ For a detailed breakdown of my designed method, please see my Analytics Architecture page ~
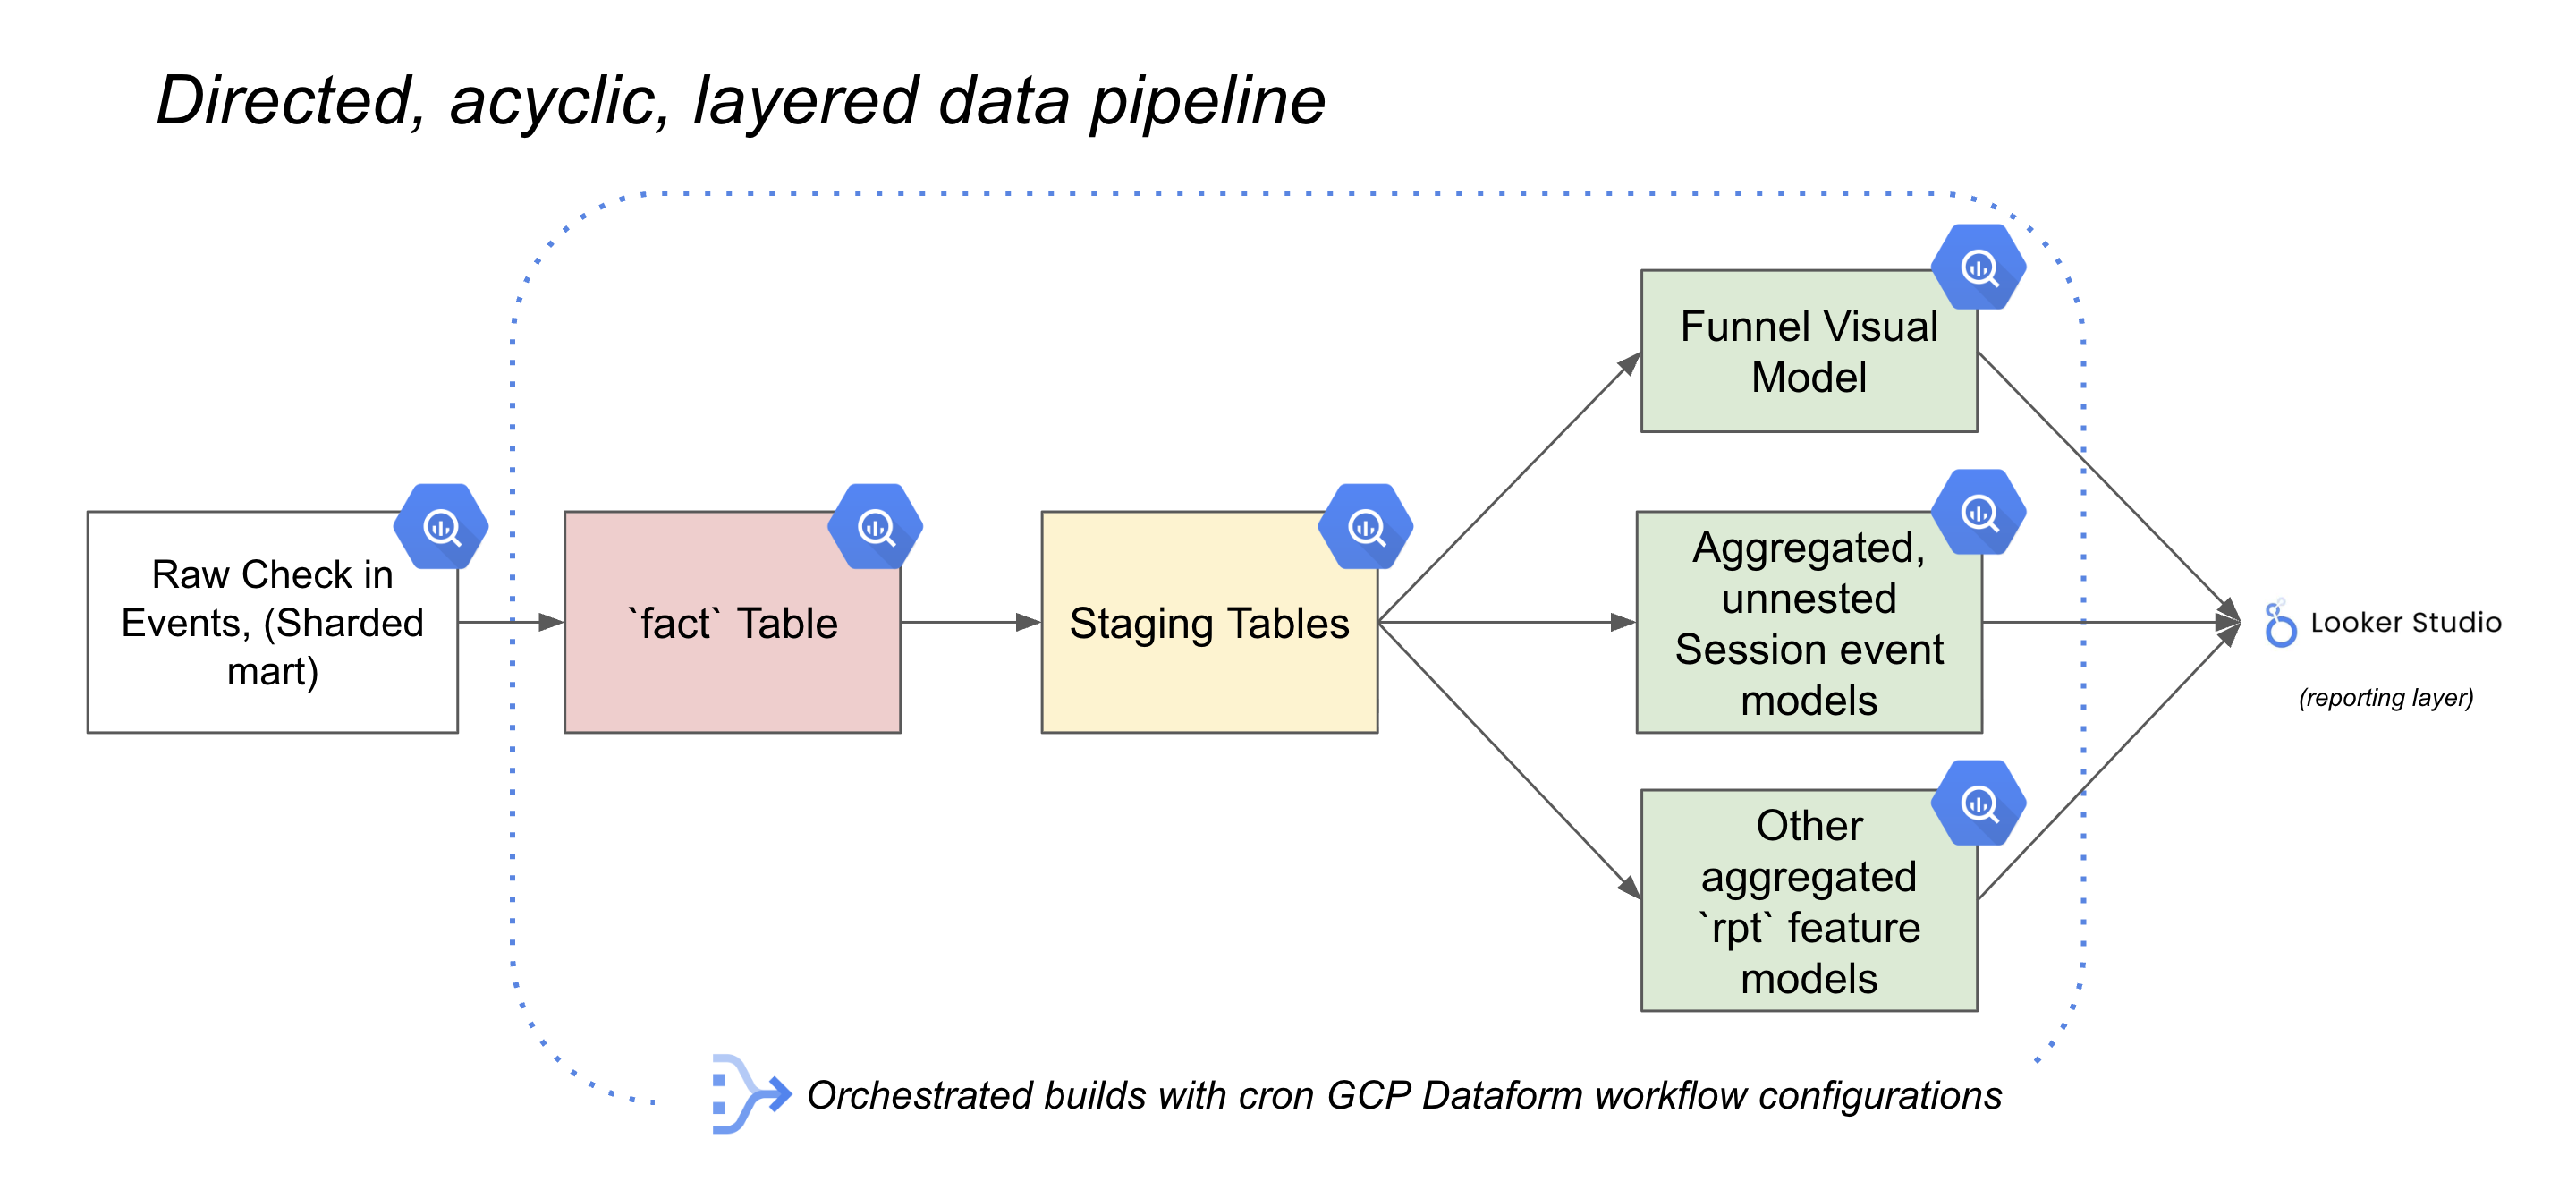
Data Flow Overview
- Raw Event Data
- Nested user event payloads ingested into big query, put into a
FACTtable - Device level data, each device reports defined events everyday
- Partitioned, clustered and retention enforcement for cost efficiency and query speed optimization
- Nested user event payloads ingested into big query, put into a
- Staging Tables
- Flattened and cleaned event structures based on downstream models, metrics and eventual visualization
- Enforced consistent schemas and naming across all
stgtables
- Report Tables
- Sessionization/time windows, user level and feature level aggregations
- Reusable and modular dependent SQL models in DataForm
- Orchestration and Automation
- Dependency managed builds with Dataform workflow configurations
- Data delivery
- Report tables were highly optimized to prevent visualization loading times and costly table scans from repeated stakeholder filtering and analysis
Why this works:
- Modular models enable rapid iteration and repeatability across system
- Partitioning and clustering vastly improve performance and keep costs low (cloud platform team = 😃)
- Clear layer separation improved reliability, trust and necessary accessibility to large tables
Analytics and Modeling Highlights
- Designed the technical logic for standard engagement metrics like Daily/Weekly/Monthly Active users, adoption and feature usage
- Modeled data at multiple levels (events, users, features etc.)
- Built reusable logic that can be implemented for other native consumer software products like Moto Games
- Standardized metrics within the framework to avoid metric drift
Dashboard and Data Delivery
I designed dashboards that reflected
- Clear metric definitions and context
- Product specific relevancy (feature performance, user adoption, relevant dimensions like location and device model)
- Time based trends and comparisons
- Accessibility for non technical stakeholders
Dashboards are actively used by
- Product managers to assess feature performance
- Business developers to evaluate partnership value, performance and monetization effect
- Leadership to monitor the high level metrics like adoption
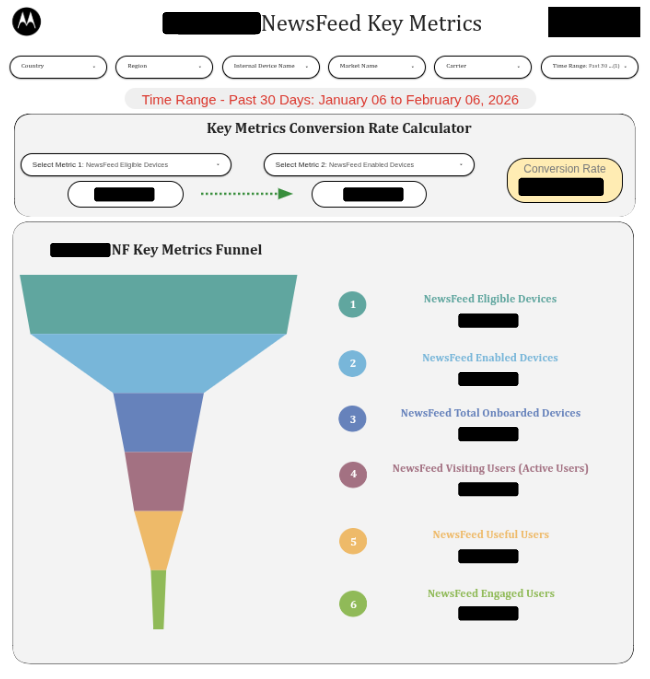
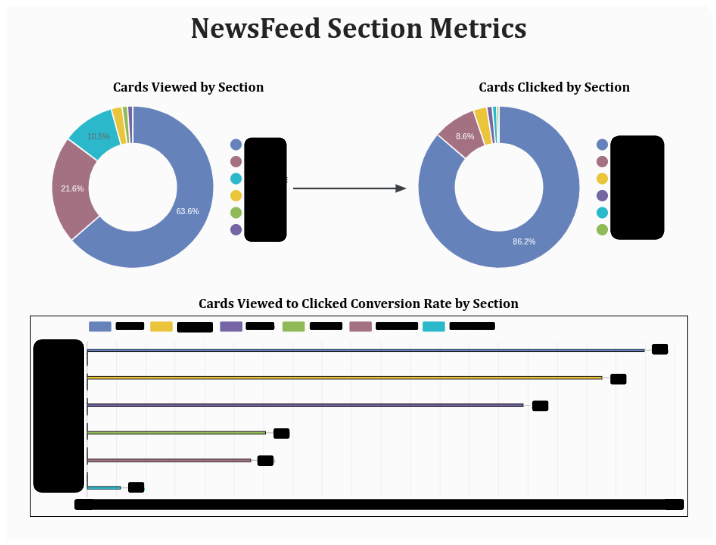
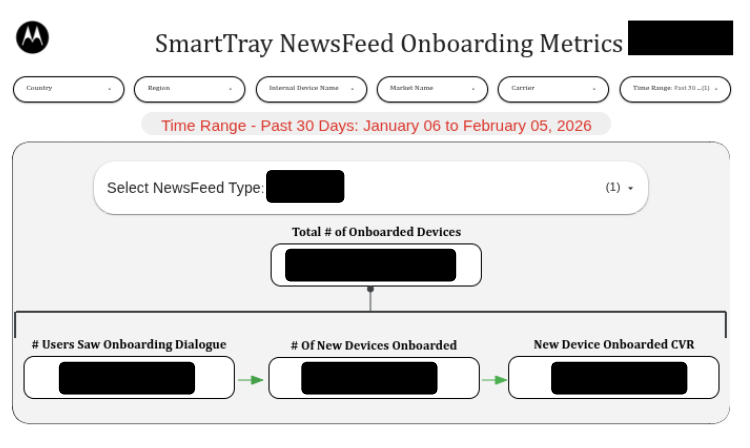
Some examples of visuals the framework feeds (click to enlarge):
Collaboration and Product Impact
This project required deep collaboration:
- Worked directly with the NewsFeed Product Manager to define metric requirements, new event collection and visualizations
- Partnered with business developers to understand partner evaluation needs and design related metrics and visuals
- Iterated on dashboard based on feedback directly from stakeholders
Impact
- Enabled fast, data informed product decisions from features and new partner opportunities
- Enabled the onboarding of > XX,XXX,XXX new devices
- Directly led to monetization improvement by $XX,XXX per month
- BD created 3 new partner business cases and 1 contract signed utilizing analytics powered by my framework
- Standardized engagement metrics across the software product
- Reduced reliance on ad hoc analysis and requests related to NewsFeed
- Vastly improved visibility into feature performance and user behavior for NewsFeed
- Discovered device configuration issues leading to increasing eligible user base
- Enabled new version rollout and health tracking across APK and SDK updates
What I’m Proud Of
- Delivering a production ready analytics system, not just a dashboard
- Bridging technical data modeling with real world business and decision intelligence questions
- Creating analytics that scaled with both data volume and product complexity/roadmap
- Empowering all product stakeholders with self serve insights
Key Takeaways
This project reflects my approach to Analytics Engineering
- Treat analytics as a product
- Develop for scale, design for trust, optimize for cost efficiency all resulting in accurate data accessibility
- Build strong working relationships across my business unit
- Focus on the end impact, in this case product and greater P&L performance; while not sacrificing strong back end infrastructure principles